
Authored by Authored By - Kalpesh Umaretia - OnM
ABSTRACT
Most photovoltaic system production simulations are conventionally run using hourly weather datasets of satellite. Hourly simulations are sufficiently accurate to predict the majority of long-term system behaviour but cannot resolve high-frequency effects like inverter clipping caused by short-duration irradiance variability. Direct modelling of this sub hourly clipping error is only possible for the few locations with high-resolution irradiance datasets. This paper presents one of the proven methodologies to calculate the PV plant and Inverter clipping losses happening in the plants with higher DC to AC installation ratios using 10 min interval SCADA data of real power and irradiation. Mostly all developers install the plant with DC to AC ratios in between 1.25 to 1.50 depending on various factor at the bid time. These plants with higher DC to AC ratio typically limit output power at plant rated power even if plant is able to deliver higher energy during peak radiation and lower temperature times. To understand the cause of performance deviation of PV plant it is necessary for the developers to understand deviation of performance due to higher or lower clipping compared to estimated in the yield assessment. It is not feasible for developer to run simulation on daily basis as well as simulation is not as accurate as this method due to hourly average out effect. The other significance of the calculation of accurate inverter and plant clipping losses is to estimate optimum DC/AC ratio selection for the projects region and to estimate the guaranteed PV plant PR (performance ratio) as due to clipping loss the PV plant PR drops & it leads misinterpretation to the observer as low performance of PV plant. If clipping loss is added to the measured PR, then the actual PR will rise to meet the expected PR.
Hence this paper presents the method to calculate the simulated power in the clipping periods based on PR trends to provide the inverter power clipping loss.
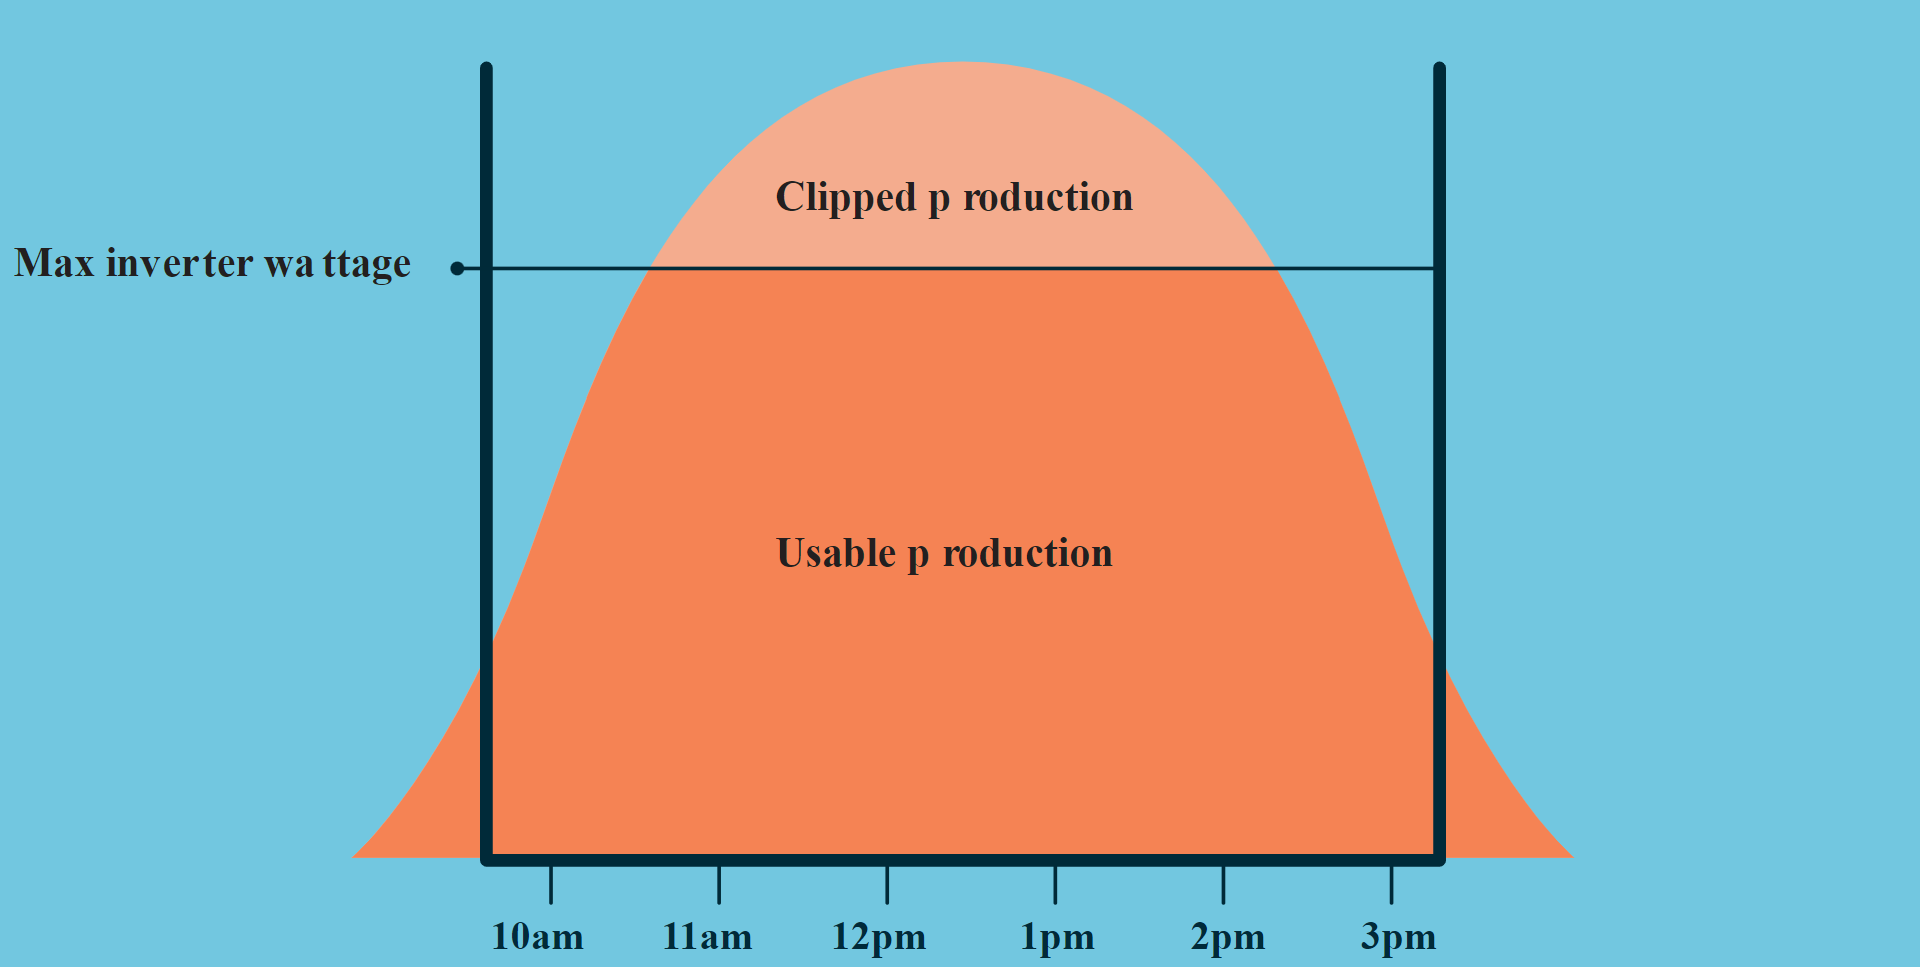
INTRODUCTIONGenerally, PV plant designers design plants to generate more energy during low radiation times by oversizing DC connected modules capacity compared to rated power of installed inverters. This higher DC:AC ratio comes with challenge that inverters shall curtail or clip the power during higher radiation and lower temperature times compared to Standard test condition (STC) at their rated power or Power plant controller limits all inverters power to comply with maximum allowed power injection limit into the grid as per power purchase agreement. In present scenarios, most of the cases when inverter is clipping power neither any alarm nor any event is generated as well as there is no information of extent of deviation of maximum power point (MPP).
The estimate of the amount of energy clipped by inverters and plant can provide insight of realistic predicted guaranteed performance Ratio of the plant as well as it indicated contribution of performance loss due to clipping so for any kind of underperformance the operators of the plant can check for other parameters affecting performance by sparing this bucket. Also Estimation of the clipping loss helps designer to set optimum DC/AC ratio of the future plants.
SAMPLING PERIODTypically, most of the simulation software (E.g. PV Syst, Meteonorm, Solar GIS, etc.) calculate energy output on hourly average/integrated data which may not represent accurate clipping losses hence to calculate most accurate clipping and to avoid spurious calculation due to limitation on refresh rate of different measuring equipment’s 5-minute average/integrated samples has been used for calculation.
PERFOAMNCE RATIO(PR)The performance ratio is a measure of the quality of a PV plant that is independent of the plant location, and it therefore, often described as a quality factor. The performance ratio (PR) is stated as percent and describes the relationship between the actual and theoretical energy outputs of the PV plant. It thus shows the proportion of the energy that is actually available for export to the grid after deduction of various system losses (e.g. due to soiling of modules, temperature losses, conversion and conduction losses, etc.).
The real time actual PR of the plant based on the 05-minute SCADA data can be calculated as per NREL Technical report NREL/TP-5200-57991 .
The Real time PR calculated as per above calculation method can be used for estimation of clipping losses which are described in sub sequent articles.
STEPS TO CALCULATE INVERTER CLIPPING LOSSTo calculate Inverter Clipping Loss following steps are followed.
Refer Below, Picture-1, example of one of the inverters having rated capacity of 1562.5 kVA at 50 ? satisfying above 3 conditions.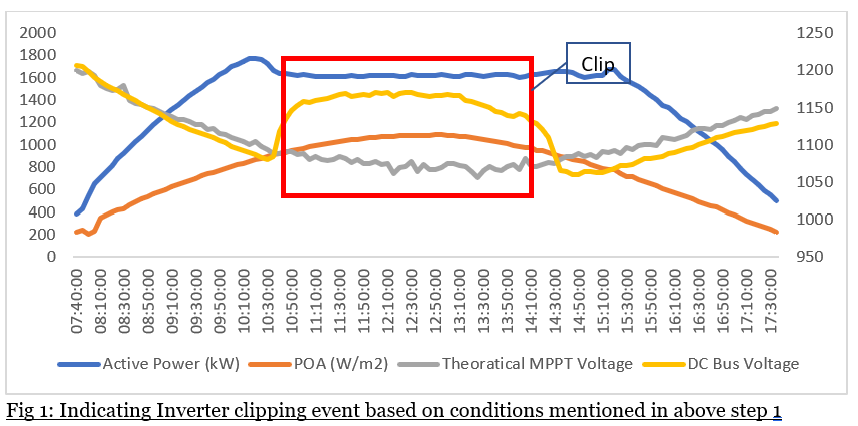
Refer below, table 1, example of running above calculation on data set of one of the inverters with rated power AC power output capacity of 1562.5 kVA at 50 ? and connected DC capacity 2380.3 KWp for 10 days. The inverter is part of 250 MW/335MWp PV plant. Also Fig.2 indicates same inverter power real measured V/S calculated using this method.
|
Sr. No. |
Date |
Average PR non clipping Period |
Average PR during Clipping Period |
Clipping Loss (KWh) |
Total Inverter Generation of the day (KWh) |
Approximate % Clipping loss of total energy |
|
1 |
01-Apr-23 |
82.74% |
65.70% |
1,375 |
12,690 |
11% |
|
2 |
02-Apr-23 |
91.17% |
66.02% |
2,316 |
14,240 |
16% |
|
3 |
03-Apr-23 |
86.03% |
69.05% |
861 |
12,883 |
7% |
|
4 |
04-Apr-23 |
90.33% |
66.58% |
1,882 |
14,134 |
13% |
|
5 |
05-Apr-23 |
88.50% |
66.01% |
1,750 |
14,147 |
12% |
|
6 |
06-Apr-23 |
92.72% |
68.50% |
1,783 |
13,115 |
14% |
|
7 |
07-Apr-23 |
90.85% |
71.22% |
1,737 |
13,238 |
13% |
|
8 |
08-Apr-23 |
87.67% |
63.17% |
1,219 |
13,204 |
9% |
Table 1: Indicated application of above-described method on one of the inverters.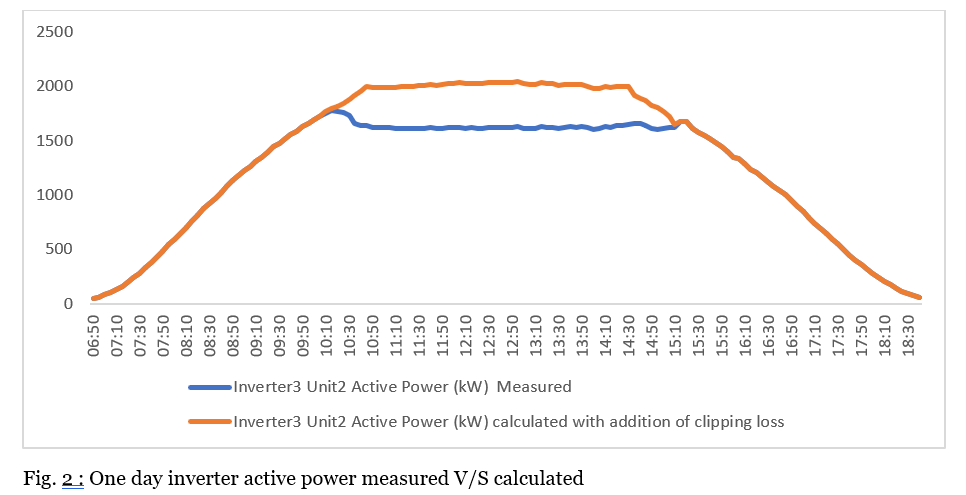
This paper presents a method of using measured site’s local weather and inverter power data to calculate clipping losses of PV plant or inverter with high-frequency irradiance variability on PV system production. The method can be applied to any location. The method validation indicated that, on sunny days this method works with precision more than 95% and on cloudy days its confidence level is above 85 % if enough weather sources are installed in the PV park. Because the method predicts clipping error at 5-minute interval, this method has the potential to be used to correct conventional hourly energy estimates. Also, this method can be used to compare real clipping losses with modelled so any other source of underperformance can be easily identified and not mistaken as clipping losses in PV plants.
Leave a comment